|
NUMBER OF BUILDING PERMITS - CITY OF BURBANK |
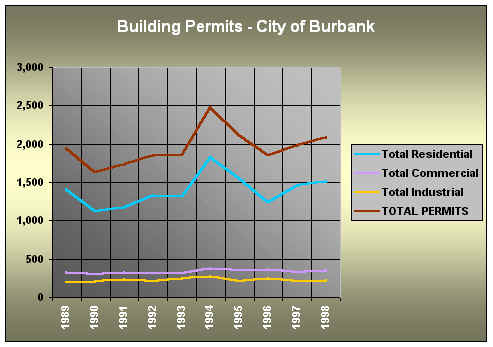
Source: City of Burbank, Building
Division
Building Permits - City of Burbank |
||||||||||
|
1989 |
1990 |
1991 |
1992 |
1993 |
1994 |
1995 |
1996 |
1997 |
1998 |
Residential |
||||||||||
Single Family Dwellings |
25 |
33 |
6 |
8 |
5 |
27 |
6 |
10 |
6 |
34 |
Two Family Dwellings |
0 |
0 |
0 |
0 |
0 |
0 |
0 |
1 |
0 |
1 |
Apartment Buildings |
93 |
1 |
4 |
7 |
2 |
4 |
2 |
0 |
1 |
4 |
Garages & Carports |
64 |
52 |
41 |
33 |
18 |
15 |
15 |
13 |
16 |
12 |
Accessory Structures |
32 |
37 |
6 |
17 |
3 |
6 |
1 |
1 |
1 |
5 |
Additions & Alterations |
1,195 |
993 |
1,120 |
1,261 |
1,284 |
1,770 |
1,529 |
1,216 |
1,432 |
1455 |
Hotels & Motels |
2 |
0 |
0 |
1 |
0 |
0 |
0 |
0 |
0 |
0 |
Total Residential |
1,411 |
1,116 |
1,177 |
1,327 |
1,312 |
1,822 |
1,553 |
1,241 |
1,456 |
1,511 |
Commerical |
||||||||||
Stores |
4 |
3 |
6 |
2 |
5 |
5 |
8 |
2 |
1 |
5 |
Offices |
10 |
5 |
2 |
2 |
7 |
3 |
5 |
9 |
4 |
2 |
Additions & Alterations (Com.) |
305 |
281 |
315 |
310 |
300 |
368 |
341 |
344 |
315 |
346 |
Parking Lots & Structures |
8 |
13 |
6 |
2 |
4 |
2 |
0 |
5 |
1 |
3 |
Total Commercial |
327 |
302 |
329 |
316 |
316 |
378 |
354 |
360 |
321 |
356 |
Industrial |
||||||||||
New Industrial Buildings |
12 |
7 |
13 |
2 |
10 |
5 |
7 |
10 |
9 |
12 |
Additions & Alterations (Ind.) |
178 |
193 |
213 |
200 |
201 |
214 |
196 |
234 |
195 |
199 |
Other Structures |
10 |
12 |
6 |
10 |
32 |
55 |
2 |
3 |
4 |
5 |
Total Industrial |
200 |
212 |
232 |
212 |
243 |
274 |
205 |
247 |
208 |
216 |
Total Industrial/Commercial |
527 |
514 |
561 |
528 |
559 |
652 |
559 |
607 |
529 |
572 |
Public Owned Buildings |
||||||||||
New Public-Owned Buildings |
2 |
1 |
1 |
0 |
0 |
0 |
0 |
1 |
0 |
0 |
Additions & Alterations |
2 |
0 |
0 |
0 |
0 |
0 |
0 |
0 |
0 |
|
Other Structures |
0 |
1 |
0 |
0 |
0 |
0 |
0 |
0 |
0 |
|
Total Public Owned Buildings |
4 |
2 |
1 |
0 |
0 |
0 |
0 |
1 |
0 |
0 |
Churches |
0 |
0 |
0 |
0 |
0 |
0 |
0 |
0 |
0 |
0 |
Private Schools |
0 |
0 |
1 |
0 |
0 |
0 |
0 |
0 |
0 |
0 |
TOTAL PERMITS |
1,942 |
1,632 |
1,740 |
1,855 |
1,871 |
2,474 |
2,112 |
1,849 |
1,985 |
2,083 |
Source: City of Burbank, Building Division |
||||||||||
VALUE OF BUILDING PERMITS - CITY OF BURBANK
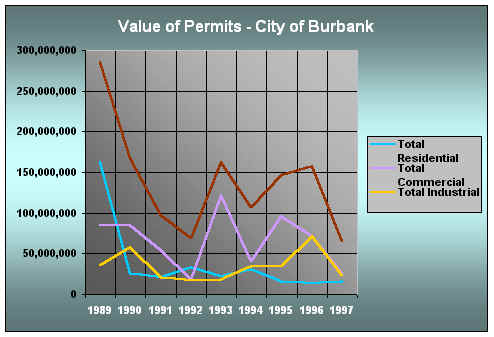
Source: City of Burbank, Building
Division
Value of Building Permits - City of Burbank |
|||||||||
|
1989 |
1990 |
1991 |
1992 |
1993 |
1994 |
1995 |
1996 |
1997 |
Residential |
|||||||||
Single Family Dwellings |
4,786,655 |
6,494,230 |
1,350,000 |
1,477,675 |
1,565,600 |
4,851,000 |
1,414,000 |
2,432,900 |
1,142,025 |
Two Family Dwellings |
0 |
0 |
0 |
0 |
0 |
0 |
0 |
284,000 |
0 |
Apartment Buildings |
117,554,884 |
1,315,000 |
2,586,751 |
15,042,246 |
9,292,000 |
10,997,210 |
1,623,000 |
0 |
810,000 |
Garages & Carports |
558,785 |
556,753 |
359,341 |
294,855 |
250,200 |
204,200 |
262,000 |
175,400 |
186,900 |
Accessory Structures |
141,250 |
383,334 |
46,700 |
279,550 |
275,300 |
252,800 |
4,500 |
4,000 |
5,170 |
Additions & Alterations |
18,868,027 |
16,890,139 |
16,450,245 |
15,404,912 |
11,093,990 |
14,556,341 |
12,412,513 |
10,371,753 |
13,480,140 |
Hotels & Motels |
20,120,000 |
0 |
0 |
1,088,000 |
0 |
0 |
0 |
0 |
0 |
Total Residential |
162,029,601 |
25,639,456 |
20,793,037 |
33,587,238 |
22,477,090 |
30,861,551 |
15,716,013 |
13,268,053 |
15,624,235 |
Commerical |
|||||||||
Stores |
12,611,000 |
9,799,200 |
18,329,700 |
871,907 |
3,086,625 |
1,714,700 |
7,732,460 |
390,000 |
90,000 |
Offices |
37,123,400 |
7,859,347 |
1,097,115 |
1,479,000 |
66,360,600 |
2,699,000 |
56,946,000 |
30,519,480 |
8,366,500 |
Additions & Alterations (Com.) |
30,145,795 |
39,028,272 |
22,038,185 |
16,315,077 |
32,531,038 |
20,359,101 |
31,366,022 |
18,132,543 |
13,653,042 |
Parking Lots & Structures |
5,499,600 |
27,623,300 |
12,773,100 |
50,500 |
20,087,000 |
16,022,000 |
0 |
22,740,000 |
3,650,000 |
Total Commercial |
85,379,795 |
84,310,119 |
54,238,100 |
18,716,484 |
122,065,263 |
40,794,801 |
96,044,482 |
71,782,023 |
25,759,542 |
Industrial |
|||||||||
New Industrial Buildings |
9,268,650 |
4,218,166 |
10,577,418 |
2,207,000 |
5,441,964 |
7,931,500 |
3,229,000 |
18,897,000 |
3,873,000 |
Additions & Alterations (Ind.) |
19,943,365 |
13,066,222 |
8,146,876 |
12,647,165 |
10,990,002 |
24,322,369 |
31,119,618 |
31,652,921 |
18,366,505 |
Other Structures |
6,671,000 |
40,474,020 |
1,799,800 |
1,836,700 |
1,807,000 |
2,575,600 |
52,000 |
20,338,000 |
1,510,000 |
Total Industrial |
35,883,015 |
57,758,408 |
20,524,094 |
16,690,865 |
18,238,966 |
34,829,469 |
34,400,618 |
70,887,921 |
23,749,505 |
Total Industrial/Commercial |
121,262,810 |
142,068,527 |
74,762,194 |
35,407,349 |
140,304,229 |
75,624,270 |
130,445,100 |
142,669,944 |
49,509,047 |
Public Owned Buildings |
|||||||||
New Public-Owned Buildings |
1,650,000 |
18,000 |
15,000 |
0 |
0 |
0 |
0 |
900,000 |
|
Additions & Alterations |
521,000 |
0 |
0 |
0 |
0 |
0 |
0 |
0 |
|
Other Structures |
0 |
720 |
0 |
0 |
0 |
0 |
0 |
0 |
|
Total Public Owned Buildings |
2,171,000 |
18,720 |
15,000 |
0 |
0 |
0 |
0 |
900,000 |
0 |
Churches |
0 |
0 |
0 |
0 |
0 |
0 |
0 |
0 |
0 |
Private Schools |
0 |
0 |
1,500,000 |
0 |
0 |
0 |
0 |
0 |
0 |
TOTAL VALUE |
285,463,411 |
167,726,703 |
97,070,231 |
68,994,587 |
162,781,319 |
106,485,821 |
146,161,113 |
156,837,997 |
65,133,282 |
Source: City of Burbank, Building Division |
|||||||||