|
SAN FERNANDO VALLEY |
Source: State Board of Equalization,
Economic Alliance of the San Fernando Valley
TAXABLE SALES |
|||||||
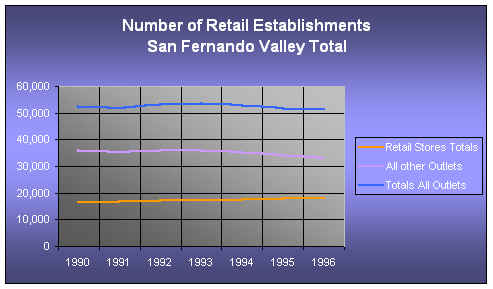
NUMBER OF RETAIL ESTABLISHMENTS - SAN FERNANDO VALLEY TOTAL |
|||||||
1990 |
1991 |
1992 |
1993 |
1994 |
1995 |
1996 |
|
Retail Stores |
|||||||
Apparel stores |
2,083 |
2,092 |
2,179 |
2,173 |
2,081 |
2,055 |
2,031 |
General merchandise stores |
395 |
428 |
491 |
532 |
556 |
524 |
503 |
Drug stores |
280 |
264 |
270 |
277 |
285 |
286 |
302 |
Food stores |
1,416 |
1,401 |
1,466 |
1,423 |
1,421 |
1,412 |
1,421 |
Packaged liqor stores |
387 |
384 |
375 |
350 |
343 |
342 |
339 |
Eating and drinking places |
3,870 |
3,882 |
3,980 |
3,969 |
3,930 |
3,952 |
3,945 |
Home furnish, and appliances |
1,118 |
1,130 |
1,114 |
1,088 |
1,080 |
1,113 |
1,110 |
Bldg. Matrl. And farm implmts. |
437 |
434 |
447 |
429 |
404 |
410 |
406 |
Auto dealers and auto supplies |
830 |
829 |
882 |
904 |
934 |
1,002 |
1,035 |
Service stations |
540 |
511 |
498 |
459 |
457 |
441 |
443 |
Other retail stores |
5,218 |
5,252 |
5,604 |
5,672 |
5,903 |
6,196 |
6,498 |
Retail Stores Totals |
16,576 |
16,715 |
17,417 |
17,398 |
17,539 |
17,888 |
18,187 |
All other Outlets |
35,933 |
35,138 |
35,881 |
36,093 |
35,170 |
34,046 |
33,013 |
Totals All Outlets |
52,508 |
51,853 |
53,299 |
53,492 |
52,709 |
51,934 |
51,200 |
Source: State Board of Equalization, Economic Alliance of the San Fernando
Valley |
|||||||
TAXABLE SALES |
|||||||
NUMBER OF RETAIL ESTABLISHMENTS - CITY OF BURBANK |
|||||||
1990 |
1991 |
1992 |
1993 |
1994 |
1995 |
1996 |
|
Retail Stores |
|||||||
Apparel stores |
62 |
53 |
73 |
84 |
86 |
86 |
82 |
General merchandise stores |
16 |
19 |
25 |
29 |
27 |
25 |
21 |
Drug stores |
22 |
20 |
21 |
21 |
22 |
19 |
26 |
Food stores |
71 |
76 |
71 |
67 |
66 |
68 |
67 |
Packaged liqor stores |
24 |
22 |
20 |
23 |
22 |
22 |
22 |
Eating and drinking places |
236 |
231 |
254 |
268 |
276 |
285 |
285 |
Home furnish, and appliances |
70 |
88 |
95 |
85 |
89 |
84 |
82 |
Bldg. Matrl. And farm implmts. |
35 |
37 |
40 |
39 |
34 |
34 |
33 |
Auto dealers and auto supplies |
51 |
50 |
57 |
57 |
60 |
59 |
60 |
Service stations |
46 |
40 |
45 |
40 |
43 |
41 |
36 |
Other retail stores |
361 |
370 |
427 |
451 |
472 |
506 |
494 |
Retail Stores Totals |
994 |
1,006 |
1,128 |
1,164 |
1,197 |
1,229 |
1,208 |
All other Outlets |
2,885 |
2,833 |
2,813 |
2,903 |
2,844 |
2,833 |
2,799 |
Totals All Outlets |
3,879 |
3,839 |
3,941 |
4,067 |
4,041 |
4,062 |
4,007 |
Source: State Board of Equalization |
|||||||
TAXABLE SALES |
|||||||
NUMBER OF RETAIL ESTABLISHMENTS - CITY OF CALABASAS |
|||||||
1990 |
1991 |
1992 |
1993 |
1994 |
1995 |
1996 |
|
Retail Stores |
|||||||
Apparel stores |
n/a |
n/a |
n/a |
n/a |
n/a |
n/a |
n/a |
General merchandise stores |
n/a |
n/a |
n/a |
n/a |
n/a |
n/a |
n/a |
Drug stores |
n/a |
n/a |
n/a |
n/a |
n/a |
n/a |
n/a |
Food stores |
n/a |
n/a |
n/a |
n/a |
n/a |
n/a |
n/a |
Packaged liqor stores |
n/a |
n/a |
n/a |
n/a |
n/a |
n/a |
n/a |
Eating and drinking places |
n/a |
n/a |
n/a |
n/a |
n/a |
n/a |
n/a |
Home furnish, and appliances |
n/a |
n/a |
n/a |
n/a |
n/a |
n/a |
n/a |
Bldg. Matrl. And farm implmts. |
n/a |
n/a |
n/a |
n/a |
n/a |
n/a |
n/a |
Auto dealers and auto supplies |
n/a |
n/a |
n/a |
n/a |
n/a |
n/a |
n/a |
Service stations |
n/a |
n/a |
n/a |
n/a |
n/a |
n/a |
n/a |
Other retail stores |
n/a |
n/a |
n/a |
n/a |
n/a |
n/a |
n/a |
Retail Stores Totals |
n/a |
106 |
111 |
123 |
147 |
155 |
154 |
All other Outlets |
n/a |
429 |
457 |
489 |
524 |
538 |
548 |
Totals All Outlets |
n/a |
535 |
568 |
612 |
671 |
693 |
702 |
Source: State Board of Equalization |
|||||||
TAXABLE SALES |
|||||||
NUMBER OF RETAIL ESTABLISHMENTS - CITY OF GLENDALE |
|||||||
1990 |
1991 |
1992 |
1993 |
1994 |
1995 |
1996 |
|
Retail Stores |
|||||||
Apparel stores |
203 |
203 |
211 |
218 |
208 |
213 |
220 |
General merchandise stores |
33 |
29 |
37 |
40 |
40 |
38 |
37 |
Drug stores |
38 |
38 |
42 |
46 |
50 |
48 |
53 |
Food stores |
147 |
142 |
158 |
155 |
154 |
151 |
145 |
Packaged liqor stores |
39 |
37 |
36 |
34 |
33 |
35 |
37 |
Eating and drinking places |
325 |
336 |
353 |
360 |
367 |
380 |
375 |
Home furnish, and appliances |
130 |
125 |
123 |
129 |
143 |
150 |
138 |
Bldg. Matrl. And farm implmts. |
59 |
57 |
62 |
60 |
53 |
52 |
51 |
Auto dealers and auto supplies |
122 |
115 |
117 |
126 |
127 |
125 |
128 |
Service stations |
56 |
53 |
53 |
49 |
49 |
48 |
47 |
Other retail stores |
611 |
611 |
649 |
674 |
703 |
748 |
781 |
Retail Stores Totals |
1,763 |
1,746 |
1,841 |
1,891 |
1,927 |
1,988 |
2,012 |
All other Outlets |
3,465 |
3,363 |
3,353 |
3,468 |
3,570 |
3,478 |
3,562 |
Totals All Outlets |
5,228 |
5,109 |
5,194 |
5,359 |
5,497 |
5,466 |
5,574 |
Source: State Board of Equalization |
|||||||
TAXABLE SALES |
|||||||
NUMBER OF RETAIL ESTABLISHMENTS - CITY OF LOS ANGELES - VALLEY |
|||||||
1990 |
1991 |
1992 |
1993 |
1994 |
1995 |
1996 |
|
Retail Stores |
|||||||
Apparel stores |
1,721 |
1,735 |
1,800 |
1,783 |
1,707 |
1,678 |
1,656 |
General merchandise stores |
316 |
348 |
398 |
434 |
457 |
434 |
418 |
Drug stores |
218 |
204 |
205 |
209 |
211 |
217 |
221 |
Food stores |
1,170 |
1,154 |
1,201 |
1,168 |
1,167 |
1,158 |
1,177 |
Packaged liqor stores |
319 |
320 |
314 |
288 |
283 |
280 |
275 |
Eating and drinking places |
3,241 |
3,241 |
3,288 |
3,256 |
3,210 |
3,208 |
3,207 |
Home furnish, and appliances |
888 |
884 |
863 |
847 |
823 |
850 |
868 |
Bldg. Matrl. And farm implmts. |
331 |
329 |
332 |
319 |
303 |
309 |
309 |
Auto dealers and auto supplies |
634 |
639 |
685 |
695 |
721 |
794 |
821 |
Service stations |
430 |
410 |
394 |
366 |
360 |
348 |
356 |
Other retail stores |
4,120 |
4,141 |
4,377 |
4,411 |
4,582 |
4,801 |
5,079 |
Retail Stores Totals |
13,389 |
13,406 |
13,857 |
13,775 |
13,822 |
14,077 |
14,387 |
All other Outlets |
27,750 |
26,513 |
27,164 |
27,142 |
26,339 |
25,334 |
24,285 |
Totals All Outlets |
41,139 |
39,920 |
41,021 |
40,917 |
40,161 |
39,411 |
38,672 |
Source: State Board of Equalization, Economic Alliance of the San Fernando
Valley |
|||||||
TAXABLE SALES |
|||||||
NUMBER OF RETAIL ESTABLISHMENTS - CITY OF SAN FERNANDO |
|||||||
1990 |
1991 |
1992 |
1993 |
1994 |
1995 |
1996 |
|
Retail Stores |
|||||||
Apparel stores |
97 |
101 |
95 |
88 |
80 |
78 |
73 |
General merchandise stores |
30 |
32 |
31 |
29 |
32 |
27 |
27 |
Drug stores |
2 |
2 |
2 |
1 |
2 |
2 |
2 |
Food stores |
28 |
29 |
36 |
33 |
34 |
35 |
32 |
Packaged liqor stores |
5 |
5 |
5 |
5 |
5 |
5 |
5 |
Eating and drinking places |
68 |
74 |
85 |
85 |
77 |
79 |
78 |
Home furnish, and appliances |
30 |
33 |
33 |
27 |
25 |
29 |
22 |
Bldg. Matrl. and farm implmts. |
12 |
11 |
13 |
11 |
14 |
15 |
13 |
Auto dealers and auto supplies |
23 |
25 |
23 |
26 |
26 |
24 |
26 |
Service stations |
8 |
8 |
6 |
4 |
5 |
4 |
4 |
Other retail stores |
102 |
106 |
126 |
111 |
121 |
116 |
118 |
Retail Stores Totals |
405 |
426 |
455 |
420 |
421 |
414 |
400 |
All other Outlets |
1,798 |
1,965 |
2,059 |
2,056 |
1,857 |
1,828 |
1,786 |
Totals All Outlets |
2,203 |
2,391 |
2,514 |
2,476 |
2,278 |
2,242 |
2,186 |
Source: State Board of Equalization |
|||||||
TAXABLE SALES |
|||||||
NUMBER OF RETAIL ESTABLISHMENTS - UNIVERSAL CITY (unincorporated) |
|||||||
1990 |
1991 |
1992 |
1993 |
1994 |
1995 |
1996 |
|
Retail Stores |
18 |
18 |
19 |
19 |
19 |
20 |
20 |
Business and Personal Services |
6 |
6 |
6 |
6 |
6 |
6 |
6 |
All other Outlets |
35 |
35 |
35 |
36 |
36 |
35 |
33 |
Totals All Outlets |
59 |
59 |
60 |
61 |
61 |
60 |
59 |
Source: State Board of Equalization |
|||||||
TAXABLE SALES |
|||||||
NUMBER OF RETAIL ESTABLISHMENTS - CITY OF LOS ANGELES - TOTAL |
|||||||
1990 |
1991 |
1992 |
1993 |
1994 |
1995 |
1996 |
|
Retail Stores |
|||||||
Apparel stores |
4,399 |
4,433 |
4,601 |
4,557 |
4,362 |
4,287 |
4,232 |
General merchandise stores |
808 |
889 |
1,018 |
1,110 |
1,167 |
1,108 |
1,069 |
Drug stores |
558 |
522 |
524 |
533 |
538 |
555 |
564 |
Food stores |
2,991 |
2,950 |
3,068 |
2,984 |
2,981 |
2,960 |
3,008 |
Packaged liqor stores |
815 |
819 |
802 |
735 |
723 |
716 |
702 |
Eating and drinking places |
8,283 |
8,282 |
8,402 |
8,321 |
8,202 |
8,199 |
8,196 |
Home furnish, and appliances |
2,268 |
2,259 |
2,206 |
2,164 |
2,104 |
2,172 |
2,219 |
|
Bldg. Material and Farm implmts. |
846 |
841 |
848 |
815 |
774 |
789 |
789 |
Auto dealers and auto supplies |
1,621 |
1,633 |
1,750 |
1,776 |
1,843 |
2,028 |
2,097 |
Service stations |
1,098 |
1,049 |
1,007 |
935 |
919 |
890 |
910 |
Other retail stores |
10,529 |
10,582 |
11,186 |
11,272 |
11,708 |
12,269 |
12,980 |
Retail Stores Totals |
34,216 |
34,259 |
35,412 |
35,202 |
35,321 |
35,973 |
36,766 |
All other Outlets |
70,913 |
67,754 |
69,416 |
69,359 |
67,308 |
64,740 |
62,059 |
Totals All Outlets |
105,129 |
102,013 |
104,828 |
104,561 |
102,629 |
100,713 |
98,825 |
Source: State Board of Equalization |
|||||||