|
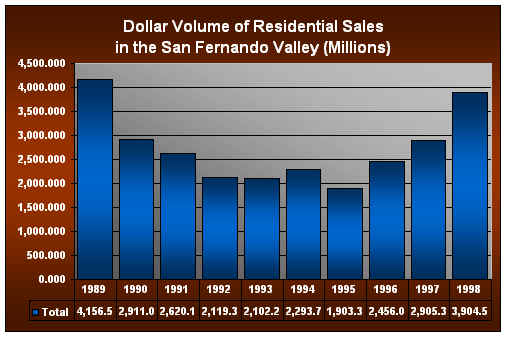
VOLUME OF RESIDENTIAL SALES IN THE SAN FERNANDO VALLEY |
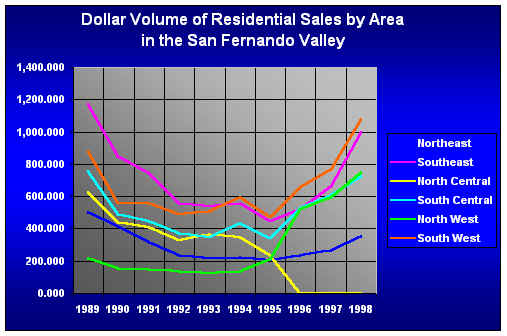
Source: Southland Regional
Association of Realtors
Note: North Central was merged into Northwest (90%) and Northeast (10%) in
1996
Source: Southland Regional
Association of Realtors
Note: North Central was merged into Northwest (90%) and Northeast (10%) in
1996
Dollar Volume of Residential Sales in the San Fernando Valley - (Millions) |
||||||||||
1989 |
1990 |
1991 |
1992 |
1993 |
1994 |
1995 |
1996 |
1997 |
1998 |
|
Northeast |
500.488 |
415.20 |
315.976 |
237.503 |
213.876 |
223.138 |
202.666 |
233.801 |
266.379 |
353.720 |
Southeast |
1,173.600 |
850.09 |
745.928 |
558.972 |
540.404 |
555.993 |
447.213 |
519.172 |
665.468 |
996.129 |
North Central |
626.177 |
442.83 |
408.901 |
325.648 |
366.083 |
344.580 |
232.600 |
n/a |
n/a |
n/a |
South Central |
756.203 |
490.35 |
445.265 |
370.954 |
348.568 |
436.362 |
343.747 |
525.100 |
609.573 |
724.578 |
North West |
219.474 |
153.26 |
148.225 |
135.880 |
125.453 |
137.321 |
207.821 |
520.802 |
597.507 |
751.707 |
South West |
880.630 |
559.36 |
555.816 |
490.425 |
507.909 |
596.385 |
469.323 |
657.181 |
766.382 |
1,078.426 |
Total |
4,156.572 |
2,911.080 |
2,620.111 |
2,119.382 |
2,102.293 |
2,293.779 |
1,903.370 |
2,456.056 |
2,905.309 |
3,904.560 |
Source: Southland Regional Association of Realtors |
||||||||||
Note: North Central was merged into Northwest (90%) and Northeast (10%) in 1996 |
||||||||||
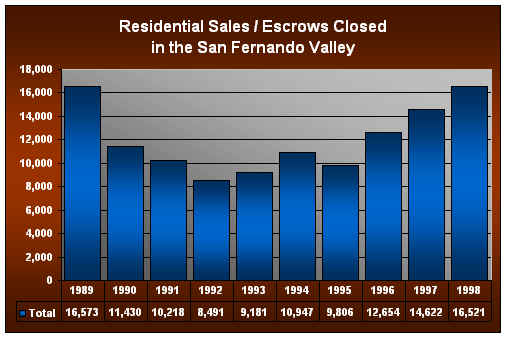
NUMBER OF SALES / ESCROWS CLOSED
IN THE SAN FERNANDO VALLEY
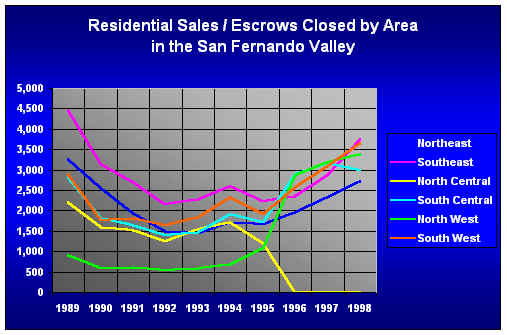
Source: Southland Regional
Association of Realtors
Note: North Central was merged into Northwest (90%) and Northeast (10%) in
1996
Source: Southland Regional
Association of Realtors
Note: North Central was merged into Northwest (90%) and Northeast (10%) in
1996
Residential Sales / Escrows Closed in the San Fernando Valley |
||||||||||
1989 |
1990 |
1991 |
1992 |
1993 |
1994 |
1995 |
1996 |
1997 |
1998 |
|
Northeast |
3,258 |
2,544 |
1,941 |
1,484 |
1,456 |
1,714 |
1,663 |
1,959 |
2,317 |
2,732 |
Southeast |
4,462 |
3,137 |
2,695 |
2,154 |
2,290 |
2,599 |
2,235 |
2,365 |
2,873 |
3,761 |
North Central |
2,217 |
1,581 |
1,520 |
1,262 |
1,539 |
1,712 |
1,200 |
n/a |
n/a |
n/a |
South Central |
2,828 |
1,802 |
1,632 |
1,401 |
1,462 |
1,910 |
1,715 |
2,881 |
3,150 |
2,998 |
North West |
909 |
599 |
610 |
536 |
588 |
677 |
1,072 |
2,877 |
3,187 |
3,390 |
South West |
2,899 |
1,767 |
1,820 |
1,654 |
1,846 |
2,335 |
1,921 |
2,572 |
3,095 |
3,640 |
Total |
16,573 |
11,430 |
10,218 |
8,491 |
9,181 |
10,947 |
9,806 |
12,654 |
14,622 |
16,521 |
Source: Southland Regional Association of Realtors |
||||||||||
Note: North Central was merged into Northwest (90%) and Northeast (10%) in 1996 |
||||||||||
RESIDENTIAL SALES AT LIST PRICE
Number of Residential Sales at List Price in the San Fernando Valley |
||||||||||
1989 |
1990 |
1991 |
1992 |
1993 |
1994 |
1995 |
1996 |
1997 |
1998 |
|
Northeast |
691 |
358 |
243 |
200 |
208 |
281 |
320 |
362 |
472 |
565 |
Southeast |
530 |
191 |
161 |
131 |
135 |
267 |
220 |
293 |
357 |
538 |
North Central |
214 |
86 |
71 |
71 |
74 |
199 |
139 |
n/a |
n/a |
n/a |
South Central |
372 |
141 |
81 |
89 |
102 |
230 |
230 |
400 |
460 |
443 |
North West |
132 |
30 |
26 |
34 |
37 |
82 |
133 |
361 |
461 |
504 |
South West |
311 |
107 |
90 |
85 |
106 |
207 |
200 |
331 |
343 |
531 |
Total |
2,250 |
913 |
672 |
610 |
662 |
1,266 |
1,242 |
1,747 |
2,093 |
2,581 |
Source: Southland Regional Association of Realtors |
||||||||||
Note: North Central was merged into Northwest (90%) and Northeast (10%) in 1996 |
||||||||||