|
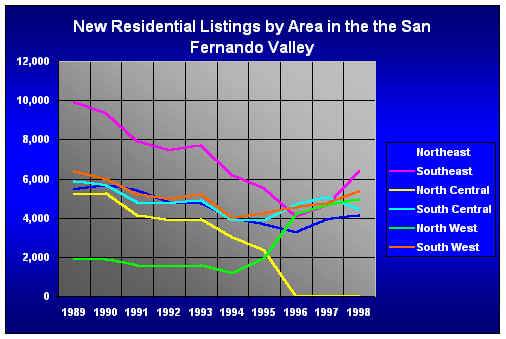
RESIDENTIAL LISTINGS |
Source: Southland Regional Association
of Realtors
Source: Southland Regional Association
of Realtors
Note: North Central was merged into Northwest (90%) and Northeast (10%) in 1996
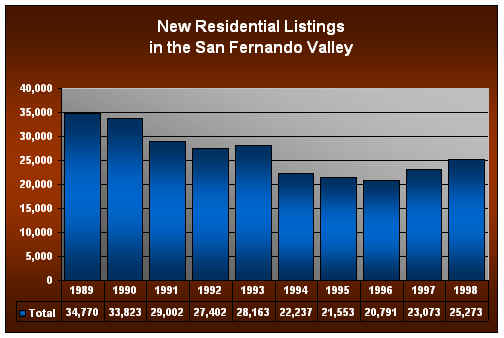
New Residential Listings in the San Fernando Valley |
||||||||||
1989 |
1990 |
1991 |
1992 |
1993 |
1994 |
1995 |
1996 |
1997 |
1998 |
|
Northeast |
5,483 |
5,657 |
5,404 |
4,802 |
4,767 |
3,959 |
3,671 |
3,245 |
3,955 |
4,152 |
Southeast |
9,895 |
9,366 |
7,919 |
7,471 |
7,714 |
6,176 |
5,499 |
4,086 |
4,636 |
6,376 |
North Central |
5,220 |
5,245 |
4,118 |
3,870 |
3,933 |
3,016 |
2,342 |
n/a |
n/a |
n/a |
South Central |
5,888 |
5,681 |
4,798 |
4,747 |
4,923 |
3,897 |
3,874 |
4,693 |
5,077 |
4,425 |
North West |
1,913 |
1,884 |
1,571 |
1,543 |
1,594 |
1,199 |
1,939 |
4,202 |
4,659 |
4,935 |
South West |
6,371 |
5,990 |
5,192 |
4,969 |
5,232 |
3,990 |
4,228 |
4,565 |
4,746 |
5,385 |
Total |
34,770 |
33,823 |
29,002 |
27,402 |
28,163 |
22,237 |
21,553 |
20,791 |
23,073 |
25,273 |
Source: Southland Regional Association of Realtors |
||||||||||
Total Active Listings in the San Fernando Valley |
||||||||||
1989 |
1990 |
1991 |
1992 |
1993 |
1994 |
1995 |
1996 |
1997 |
1998 |
|
Northeast |
15,657 |
21,471 |
24,109 |
23,859 |
21,856 |
15,603 |
15,208 |
12,727 |
12,668 |
12,264 |
Southeast |
29,683 |
37,025 |
37,147 |
37,361 |
34,993 |
24,826 |
22,505 |
16,014 |
14,039 |
15,972 |
North Central |
15,576 |
21,500 |
19,061 |
18,411 |
16,456 |
10,158 |
7,750 |
n/a |
n/a |
n/a |
South Central |
16,923 |
22,470 |
23,368 |
23,377 |
21,712 |
15,388 |
16,568 |
18,251 |
15,035 |
11,170 |
Northwest |
5,611 |
8,318 |
7,877 |
8,004 |
7,125 |
4,529 |
8,653 |
15,471 |
12,916 |
11,614 |
Southwest |
18,975 |
25,156 |
25,315 |
25,087 |
22,625 |
14,574 |
16,890 |
17,700 |
14,430 |
12,733 |
Total |
102,425 |
135,940 |
136,877 |
136,099 |
124,767 |
85,078 |
87,574 |
80,163 |
69,088 |
63,753 |
Source: Southland Regional Association of Realtors |
||||||||||
Note: North Central was merged into Northwest (90%) and Northeast (10%) in 1996 |
||||||||||
Residential Listing Expirations in the San Fernando Valley |
||||||||||
1989 |
1990 |
1991 |
1992 |
1993 |
1994 |
1995 |
1996 |
1997 |
1998 |
|
Northeast |
1,493 |
2,708 |
2,532 |
3,106 |
2,840 |
2,079 |
1,667 |
1,517 |
1,326 |
1,076 |
Southeast |
3,214 |
4,794 |
3,930 |
4,520 |
4,064 |
2,786 |
2,278 |
1,674 |
1,222 |
1,269 |
North Central |
1,549 |
2,848 |
2,137 |
2,065 |
1,796 |
1,130 |
612 |
n/a |
n/a |
n/a |
South Central |
1,603 |
2,620 |
2,310 |
2,731 |
2,433 |
1,691 |
1,661 |
1,945 |
1,362 |
927 |
North West |
480 |
986 |
807 |
870 |
738 |
497 |
860 |
1,571 |
1,233 |
860 |
South West |
1,685 |
3,027 |
2,491 |
2,826 |
2,372 |
1,429 |
1,471 |
1,777 |
1,166 |
896 |
Total |
10,024 |
16,983 |
14,207 |
16,118 |
14,243 |
9,612 |
8,549 |
8,484 |
6,309 |
5,028 |
Source: Southland Regional Association of Realtors |
||||||||||
Note: North Central was merged into Northwest (90%) and Northeast (10%) in 1996 |
||||||||||