|
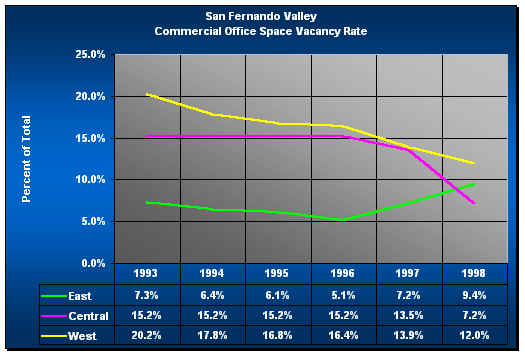
SAN FERNANDO VALLEY |
Source: Grubb & Ellis, Inc.
COMMERCIAL OFFICE SPACE VACANCY RATES
Commercial Office Space Vacancy - Rate |
||||||
Valley Sub-Markets |
||||||
1993 |
1994 |
1995 |
1996 |
1997 |
1998 |
|
East |
7.00% |
6.40% |
6.10% |
5.10% |
7.20% |
9.00% |
Central |
15.20% |
15.20% |
15.20% |
15.20% |
13.50% |
7.20% |
West |
20.20% |
17.80% |
16.80% |
16.40% |
13.90% |
12.00% |
Source: Grubb & Ellis, Inc. |
||||||
COMMERCIAL OFFICE SPACE VACANCY - SQUARE FOOTAGE
Commercial Office Space Vacancy - Square Footage |
||||||
Valley Sub-Markets |
1993 |
1994 |
1995 |
1996 |
1997 |
1998 |
East |
6,205,000 |
6,101,000 |
5,811,000 |
5,856,000 |
5,856,000 |
6,260,000 |
Central |
7,870,000 |
7,366,000 |
7,087,000 |
7,240,000 |
7,240,000 |
7,202,000 |
West |
7,430,000 |
7,251,000 |
7,169,000 |
7,054,000 |
7,094,000 |
7,120,000 |
Source: Grubb & Ellis, Inc. |
||||||
Source: CB Commercial Real Estate
Group, Inc. 1998 Southern California Real Estate Forecast
Note: Figures based on multi-tenant, Class A & B office buildings greater than 30,000
square feet. Excludes government and medical buildings. Vacant square footage does not
include sublease space
Source: CB Commercial Real Estate Group, Inc. 1998 Southern California Real Estate
Forecast
Note: Figures based on multi-tenant, Class A & B office buildings greater than 30,000
square feet. Excludes government and medical buildings. Vacant square footage does not
include sublease space
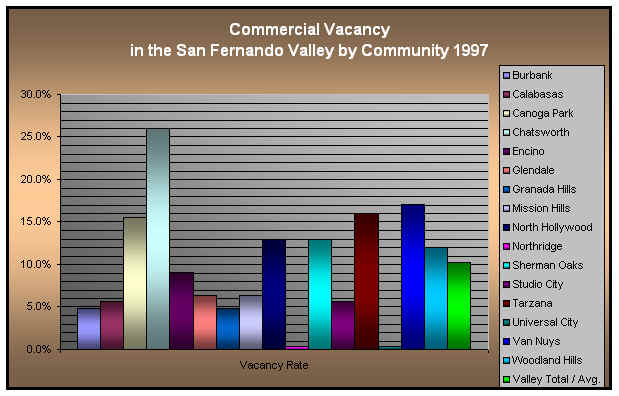
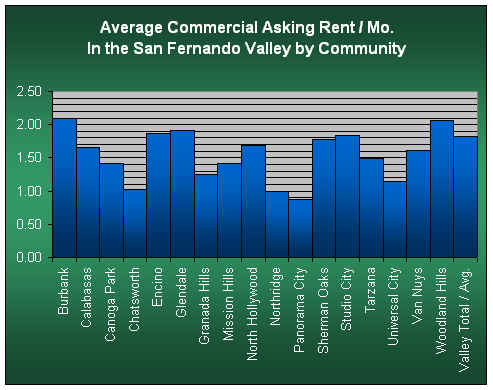
COMMERCIAL OFFICE SPACE - STATISTICS
Commercial Office Space Statistics - 1997 |
|||||
| Sub-Market | Vacancy Rate |
Vacancy Square Footage |
Net Rentable Area |
Average Asking Rent Per Month |
Net Absorption |
Burbank |
4.8% |
171,767 |
3,562,922 |
2.09 |
(25,476) |
Calabasas |
5.7% |
67,010 |
1,179,800 |
1.65 |
4,372 |
Canoga Park |
15.5% |
29,418 |
189,702 |
1.41 |
13,826 |
Chatsworth |
26.0% |
123,679 |
476,593 |
1.03 |
60,491 |
Encino |
9.1% |
305,428 |
3,364,409 |
1.86 |
184,072 |
Glendale |
6.4% |
307,447 |
4,818,543 |
1.92 |
19,423 |
Granada Hills |
4.8% |
4,807 |
101,000 |
1.25 |
33,044 |
Mission Hills |
6.3% |
9,932 |
158,730 |
1.42 |
16,474 |
North Hollywood |
12.9% |
138,132 |
1,074,762 |
1.69 |
124,484 |
Northridge |
0.4% |
1,499 |
427,556 |
1.00 |
10,149 |
Panorama City |
90.2% |
326,637 |
362,211 |
0.88 |
(291,030) |
Sherman Oaks |
13.0% |
228,059 |
1,756,712 |
1.78 |
154,970 |
Studio City |
5.7% |
13,164 |
230,987 |
1.84 |
1,065 |
Tarzana |
16.0% |
92,886 |
579,000 |
1.49 |
26,802 |
Universal City |
0.4% |
5,491 |
1,303,000 |
1.15 |
(315) |
Van Nuys |
17.1% |
193,469 |
1,133,931 |
1.61 |
(868) |
Woodland Hills |
12.0% |
637,646 |
5,330,538 |
2.07 |
332,028 |
Valley Total / Avg. |
10.2% |
2,656,471 |
26,050,396 |
1.82 |
663,511 |
Source: CB Commercial Real Estate Group, Inc. 1998
Southern California Real Estate Forecast |
|||||